To a developer, debugging, profiling and tracing tools are akin to the tools that a craftsman carries in a belt on construction sites. In fact, constructing robust code is as important as observing how it behaves during actual execution on production hardware. Ideally, developers would want to know as much relevant information about the software they are writing, but every introduction of an observation hook in the software would change how the software would behave, thereby making transient faults harder to debug. As Jim Gray said,
“Most production software faults are soft. If the program state is reinitialized and the failed operation retried, the operation will usually not fail the second time.”
The effect of invasive debugging on the target software can be reduced by using specialized techniques of static and dynamic code instrumentation that allows a tracing tool to continuously monitor events of interest. Such tracing tools are also important to monitor systems continuously over long runs with minimum overhead. Ftrace, LTTng, eBPF and Dtrace are examples of such software tools that allow recording of events over long executions for targeted analysis. Thus, in essence, tracing would allow a low-overhead, always-on event recording mechanism which can be used for post-mortem analysis or live monitoring depending on the intended use-case. There has, however always been an impact of tracing tools themselves on the system under observation. While this is negligible, it can accumulate over time and for time-critical scenarios, and what is indeed interesting is the idea of traceless tracing—where the CPU itself sends raw data about what it is executing rather than explicit software hooks in the software.
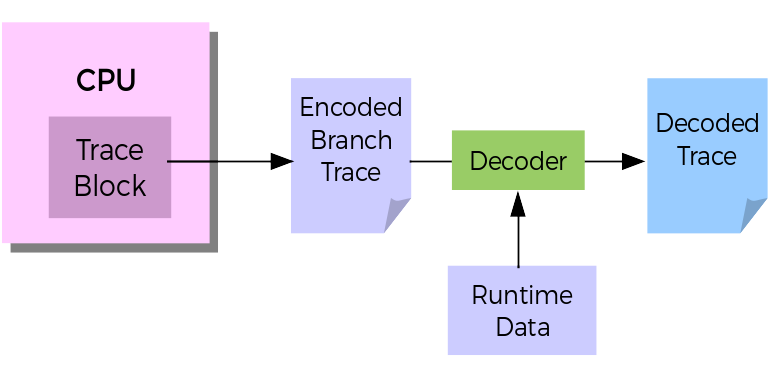
Special support for recording instruction and program flow directly from the CPU has been used in the embedded world before. Embedded processors chips have supported JTAG with special ports that can be used to control debugging and tracing remotely. Such facilities to tap the instruction and data bus of processor directly to observe the execution flow and control it have been present in early versions of ARM and MIPS processors. Modern Intel machines have had similar support in the form of Last Branch Record (LBR), Branch Trace Store (BTS) and Intel Processor Trace (PT), which would allow recording only the change-of-flow instructions during execution. This branch trace information comes directly from the CPU, as encoded hardware trace packets in platform specific formats which can then be merged with disassembled binary instructions to generate a complete flow of the program. With debug symbols obtained at runtime, recorded IPs and accurate timestamps, call-stacks can be reconstructed with cycle-accurate details. Some processors even support data flow trace recording on separate channels along with the program flow.

Fig 1. Illustration of hardware-assisted branch tracing
Such granular analysis of program flow is like recording an X-ray of the whole program as it executes. Developers have been quick to exploit these capabilities for enhancing systems security, improving and optimizing binaries and analysis of systems performance. As an example, the fuzzing framework, hongfuzz now supports Intel Process Trace (PT) based hardware-assisted fuzzing while Chen et al. recently demonstrated application optimization using hardware trace based Feedback-Directed Optimization techniques (FDO) recently in the ACM CGO 2016 conference. PT based techniques for low-overhead, traceless VM introspection have been recently proposed as well. In the area of efficient debugging, GDB’s record and replay functionality has seen a major improvement with the use of BTS and PT based hardware assistance which allows accurate and faster reconstruction of program flows.
Hardware-tracing has traditionally involved the use of external trace buffers and interfaces such as ARM’s DSTREAM or Lauterbach’s PowerTrace, which is still widely used by automotive and industrial embedded systems developers. However, the accessibility of such features has increased recently by allowing the traces gathered from on-chip buffers to be offloaded to system’s memory and the disk. Intel Processor Trace (PT) and ARM CoreSight can now be accessed directly from the Perf subsystem of the Linux kernel. PT is exposed as yet another perf event and the hardware-trace data is recorded as part of the performance data recorded by Perf. The recorded traces can be decoded by Linaro’s OpenCSD library (in case of CoreSight traces) or Intel’s processor-trace library, both of which have been open sourced. This means developers can now directly access hardware trace snapshots for executions of code where they need the high-resolution X-ray vision.
It is important to note however, that the high bandwidth CPU branch traces can’t generally keep up with in-memory trace record, therefore it is advisable for developers to integrate such solutions in scenarios where short spans of hardware trace data is necessary. To illustrate this, we can take an example of a real-time system, where abnormal scheduling and interrupt latencies can occur unpredictably. As Francis Giraldeau demonstrates, rare abnormal latencies can’t be detected in a single debug session. Long term traces for over a week can be the norm. In such scenarios, hardware traces running in snapshot mode can be lifesavers as they can deliver greater insight on program execution than what can be traditionally obtained with software tracing. Infact, RedHat’s Linux kernel crash utility precisely provides this feature of recording a trace snapshot using its ptdump extension during kernel crashes. The current challenge with hardware tracing is the enormity of the data collected. The decoding in such scenarios is always offline and use cases of live analysis would not fit the picture. However, more data also means more opportunities for getting accurate analyses. As an example, exact nature of shape-shifting and elusive malwares can possibly be detected by using pattern matching and machine learning based techniques on huge trace datasets, thus complementing dynamic analysis of malwares and viruses in modern systems.
This is an interesting direction for future research. Adoption of cutting edge hardware tracing for production servers and desktop machines has increasingly become easier for developers. Since the launch of Intel’s Skylake processors, almost all consumer laptops and servers now have readily usable hardware tracing blocks. ARM’s recent venture into the server market has also ensured that technology which mostly dominated the embedded development environments can now be widely utilized, and help in developing more creative ways of utilizing hardware tracing.
About the Author
Dr. Suchakrapani Sharma is a Scientist at ShiftLeft Inc. He is an alumnus of DORSAL Lab at École Polytechnique de Montréal, contact him at suchakrapani.sharma@polymtl.ca
Disclaimer: These posts are written by individual contributors to share their thoughts on the Computer Architecture Today blog for the benefit of the community. Any views or opinions represented in this blog are personal, belong solely to the blog author and do not represent those of ACM SIGARCH or its parent organization, ACM.


